 Maple(2)
2次元のグラフ
 まず、maple と打ちます。
c9912149@happy-1[3]_% maple
|\^/| Maple V Release 4 (The Univeristy of Electro-Communications)
._|\| |/|_. Copyright (c) 1981-1996 by Waterloo Maple Inc. All rights
\ MAPLE / reserved. Maple and Maple V are registered trademarks of
<____ ____> Waterloo Maple Inc.
| Type ? for help.
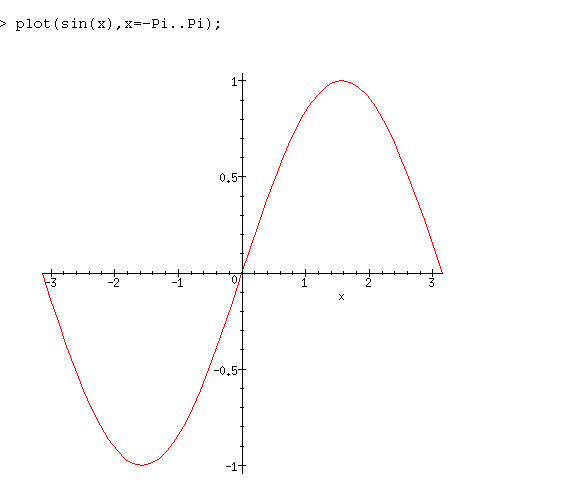
 つぎに、plotを用いてkterm上に2次元グラフをかく。
> plot(sin(x),x=-Pi..Pi);
|
1 + AAAAAAAA
+ AA AA
| A AA
+ A A
+ AA AA
| AA AA
+ AA AA
| A A
0.5 + A AA
+ AA AA
| A A
+ A AA
+ A A
|A A
* AA
* A
*+-+-+-+-++-+-+-+-+-+-+-+-+-+*++-+-+-+-+-+-+-+-+-++-+-+-+-+*
-3 -2 -1 0A+ 1 2 3
A A |
A A +
A A +
A A |
AA A +
A -0.5 +
A A |
A AA +
AA AA |
AA A +
A A +
AA A |
AA AA +
AAAAAAAA -1 +
|
 このグラフを-windowで表示する。
 表示の設定をかえるには,plotsetupを使います。
> plotsetup(x11);
 そして同じ式を書いて、プロットしてみます。
> plot(sin(x),x=-Pi..Pi);

 最後に quit 打って maple を終りにします。